.png)

Most e-commerce founders assume conversion optimization is a design problem. Change the button color, tighten the headline, swap the hero image, and watch sales climb. But that instinct leads you straight into a trap. Analytics uncovers counterintuitive wins that gut-driven UI changes consistently miss, and the revenue gap between brands that use data and brands that guess keeps widening. This article breaks down how to use analytics to find the real levers in your funnel, interpret what the numbers actually mean, and apply those insights to drive measurable conversion improvements across your campaigns and landing pages.
| Point | Details |
|---|---|
| Analytics beats intuition | Data analysis uncovers hidden revenue drivers that gut-based tweaks often miss. |
| Use both quant and qual | Mix funnel reports and heatmaps with session recordings and surveys for actionable insights. |
| Data integrity is essential | Establish robust tracking plans to avoid costly errors and misinterpretation. |
| Tool selection matters | Choose the right analytics platforms like GA4, Hotjar, or Optimizely to empower your CRO strategy. |
| Prioritize revenue uplift | Focus on analytics-led improvements that increase order value, not just conversion rate. |
Building on the idea that analytics changes the entire game, let’s see what it uncovers that intuition often misses.
Most marketers start with a hypothesis that feels obvious. “Our checkout is too long.” “The page loads too slow on mobile.” “Users don’t trust us enough.” These guesses are not always wrong, but they are incomplete. Intuition is shaped by your own experience as a user, not by the behavior of thousands of actual buyers moving through your specific funnel. The result is that you optimize for the wrong thing, spend budget on tests that don’t move revenue, and miss the real bottleneck entirely.
Here is what analytics surfaces that gut instinct almost never catches:
That last point is one of the most important and most ignored findings in CRO. A lower conversion rate can mean higher revenue if the buyers who do convert spend significantly more. Analytics is the only tool that catches this.
“Focusing only on conversion rate without tracking revenue impact is one of the most common and costly mistakes in e-commerce optimization.”
Brands that run into scale challenges almost always share one trait: they optimized for vanity metrics instead of revenue metrics. Analytics forces you to look at the full picture.
Pro Tip: Before running any landing page testing, define your primary metric upfront. Is it conversion rate, revenue per visitor, or AOV? Testing without a clear success metric produces data that is easy to misread.
Once you recognize analytics is critical, the next step is understanding which methodologies drive actionable insights.
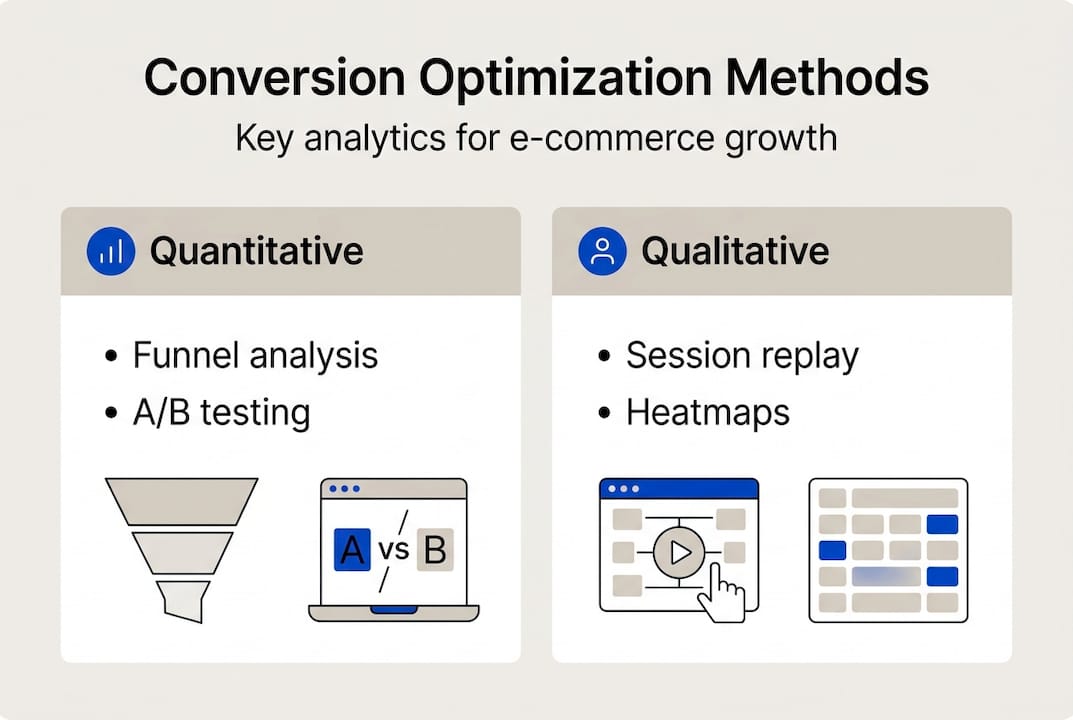
There are two broad categories of analytics: quantitative and qualitative. Neither works as well alone. Combining both approaches leads to sharper hypotheses and more effective tests because numbers tell you where the problem is, and qualitative tools tell you why it exists.
Here is a practical sequence for building an analytics-led CRO workflow:
| Method | Type | Strengths | Best tools |
|---|---|---|---|
| Funnel analysis | Quantitative | Identifies drop-off points | GA4, Shopify analytics |
| Event tracking | Quantitative | Tracks specific user actions | GA4, Segment |
| Heatmaps | Qualitative | Shows click and scroll behavior | Hotjar, Clarity |
| Session recordings | Qualitative | Reveals real user journeys | Hotjar, FullStory |
| Exit surveys | Qualitative | Captures user objections | Hotjar, Typeform |
| A/B testing | Mixed | Validates hypotheses with data | Optimizely, VWO |
Pro Tip: Review the types of landing page tests before designing your first experiment. Choosing the wrong test type wastes weeks of traffic. Also, use a CRO audit checklist to verify your tracking setup before you trust any data. Learn more about conversion method basics to build a solid foundation.
Now that you know the methodologies, let’s look at which tools power those analytics strategies.
The analytics tool landscape is crowded, but most e-commerce teams only need a focused stack. The goal is not to collect more data. It is to collect the right data and act on it faster.
A critical warning: GA4 event tracking is foundational, Hotjar and Clarity provide behavioral heatmaps, and Optimizely and VWO support structured sequential testing. But using all of them without a unified reporting layer creates conflicting numbers. That conflict is expensive. Roughly 30% of CRO errors trace back to bad or inconsistent data across tools.
| Tool | Core function | Best for | Free tier? |
|---|---|---|---|
| GA4 | Funnel and event tracking | Traffic analysis, goal tracking | Yes |
| Hotjar | Heatmaps and recordings | Behavioral insights | Yes (limited) |
| Microsoft Clarity | Heatmaps and session replay | Budget-friendly behavioral data | Yes |
| Optimizely | A/B and multivariate testing | Enterprise-level experimentation | No |
| VWO | A/B testing and surveys | Mid-market testing programs | Limited |
| Shopify analytics | Native e-commerce reporting | Revenue and product performance | Yes (with Shopify) |
Key principles for building a clean analytics stack:
For brands exploring Google Analytics for marketing decisions, GA4’s exploration reports are particularly useful for segmenting by traffic source and device type. And if you want to see how analytics-led decisions play out in practice, the case study results section shows real outcomes from structured testing programs.
With tools in hand, let’s see how analytics turns insight into higher conversions and revenue.

The difference between a brand that grows and one that plateaus often comes down to whether they measure revenue impact rather than just conversion rate percentage. Uplift, meaning actual revenue gained per visitor, is the metric that matters. A 2% lift in conversion rate on a low-AOV product can be worth less than a 0.5% lift on a high-AOV product. Analytics makes that math visible.
Here are real patterns that analytics-first approaches consistently surface:
For a detailed look at how this plays out in a specific vertical, the supplement brand optimization case study shows exactly how layered analytics led to sustained revenue gains. And for counterintuitive CRO results that challenge conventional wisdom, the pattern repeats across categories.
Pro Tip: Always validate AI-generated or automated insights with human review. Automated tools flag anomalies well, but they cannot tell you whether a behavioral pattern reflects a real user problem or a tracking glitch. A human eye catches the difference.
Here is what four years of running tests, auditing funnels, and watching brands scale and stall has taught us: gut-driven CRO has a ceiling, and most brands hit it faster than they expect.
The first few wins from intuition-based changes feel validating. You move a button, shorten a form, add a testimonial, and conversion rate ticks up. But those wins are low-hanging fruit. Once you pick them, the next layer of improvement requires knowing things your gut simply cannot tell you. Which traffic segment is underperforming? Which step in the funnel is leaking revenue silently? Which product page has a trust gap that copy alone cannot fix?
Brands that rely on rigorous data instead of instinct find winning strategies that gut-driven teams consistently overlook. The uncomfortable part is that analytics-first CRO requires more patience upfront. You have to instrument correctly, wait for statistical significance, and resist the urge to call a test early because the trend looks promising.
The fallacy of UI-only optimization is that it treats conversion as a design problem when it is actually a communication and trust problem. Analytics tells you where trust breaks down, where the message misaligns with user intent, and where friction is real versus perceived. Our ads CRO approach is built entirely around this principle: data first, creative second, always.
If you are ready to move beyond guesswork and build a conversion program that compounds over time, Blue Bagels is built for exactly that. Our ads CRO services combine four years of testing data with direct response creative that is engineered to convert, not just impress. From landing page solutions grounded in behavioral insights to full-funnel creative strategies backed by real test results, we give e-commerce brands the analytical foundation and the creative execution to grow. Browse our display case studies to see how analytics-led decisions translate into measurable revenue gains for brands across categories.
Conversion optimization is the process of using data, testing, and behavioral insights to increase the percentage of visitors who complete desired actions, like purchases or sign-ups, on your e-commerce site. Analytics-led CRO consistently outperforms gut-driven changes by targeting the actual friction points in a funnel.
GA4, Hotjar, Optimizely, and Shopify analytics each serve different functions, from funnel analysis to heatmaps and structured A/B testing. GA4, Hotjar, Clarity, Optimizely, and VWO are the most commonly used tools across e-commerce CRO programs.
Use quantitative tools like GA4 for funnel mapping and event tracking, then layer in qualitative tools like session recordings and exit surveys to understand the reasons behind the numbers. Combining both methods produces sharper hypotheses and more reliable test outcomes.
Ignoring data integrity and relying on UI tweaks without behavioral context are the most costly errors. Bad data causes roughly 30% of CRO errors, leading teams to optimize for the wrong variables and miss real revenue opportunities.
