.png)

TL;DR:
- Full funnel optimization treats the entire customer journey as one connected system.
- Mapping and diagnosing funnel leaks with analytics tools identify significant revenue drop-off points.
- Prioritize tests based on revenue per visitor to effectively increase overall e-commerce revenue.
You’re spending real money on ads, traffic is flowing in, and yet your revenue numbers refuse to budge. That gap between ad spend and actual sales is almost never caused by one broken page. It’s caused by a funnel that leaks at multiple stages simultaneously, and most teams only patch one hole at a time. Global e-commerce CVR sits between 2.5% and 3%, which means 97 out of every 100 visitors leave without buying. If you’re only tweaking your checkout flow or running a single landing page test, you’re leaving the majority of your revenue gains on the table. This guide walks you through mapping, testing, and measuring your entire funnel so every dollar of ad spend works harder.
| Point | Details |
|---|---|
| Focus on the entire funnel | Optimizing every stage yields bigger wins than fixing isolated leaks. |
| Map, test, and prioritize | Use analytics tools and RPV to find and address the most valuable opportunities. |
| Test strategically | Direct most testing on cart and checkout for maximum ROAS impact. |
| Iterate and measure | Regularly check results with RPV and ROAS to sustain and scale upgrades. |
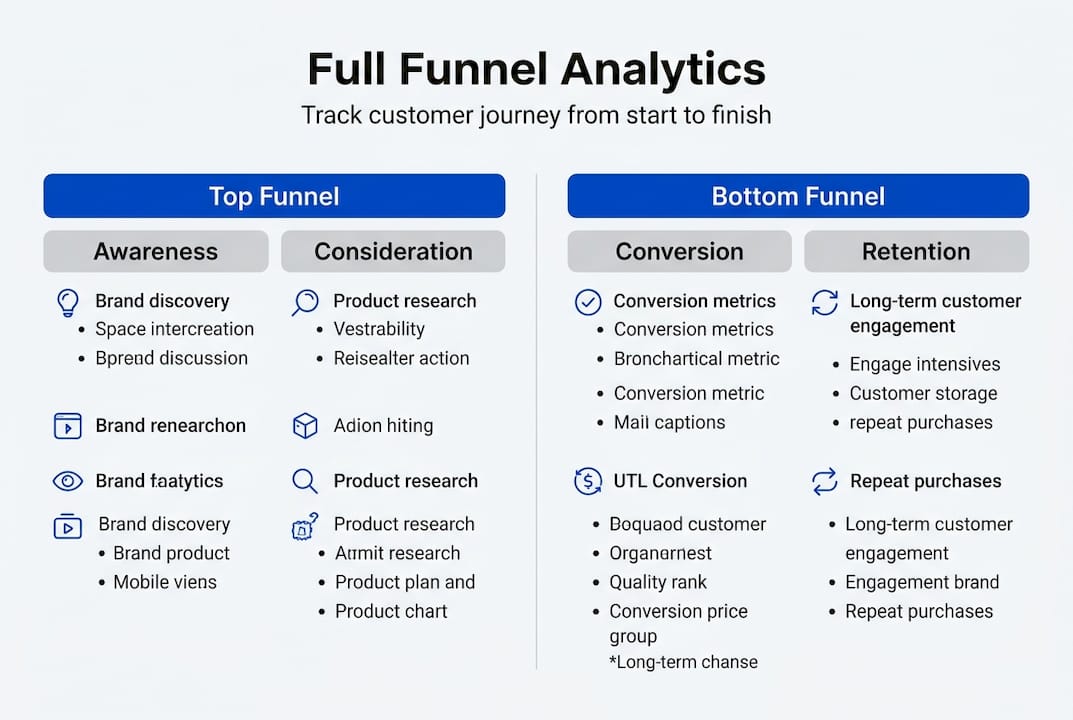
Full funnel optimization means treating your entire customer journey as one connected system, from the first ad impression through to repeat purchase, rather than fixing isolated stages in isolation. The funnel has four broad stages: awareness (reaching new audiences), consideration (engaging and educating potential buyers), conversion (turning visitors into customers), and retention (keeping those customers coming back). Each stage feeds the next. A weak awareness campaign sends low-intent traffic that tanks your conversion rate. A strong product page means nothing if your checkout is broken.
The problem is that most e-commerce teams optimize in silos. One person owns the ads, another owns the website, and nobody owns the handoff between them. That’s why brands struggle to scale past a certain revenue ceiling. When you fix one stage without understanding how it connects to the others, you often create new bottlenecks downstream.
Here’s what the data looks like when you benchmark a typical store:
According to 2026 e-commerce funnel benchmarks, global average CVR is 2.5 to 3%, add-to-cart rate is roughly 6.8%, and cart abandonment sits at a staggering 76%. That means three out of four shoppers who add something to their cart never complete the purchase.
Full funnel vs. single-stage optimization
| Approach | Focus area | Typical outcome |
|---|---|---|
| Single-stage | Checkout only | Marginal CVR lift, ceiling hit fast |
| Single-stage | Product page only | Better engagement, same checkout drop-off |
| Full funnel | All stages, integrated | Compounding gains across CVR, AOV, and LTV |
| Full funnel | Data-driven sequencing | Sustainable ROAS improvement over time |
Why do conversion efforts stall? A few common reasons:
A solid e-commerce funnel analytics setup is the foundation that makes integrated optimization possible. Without it, you’re guessing. A good website optimization guide can also help you understand what to measure at each stage before you start making changes.
Once you recognize the need for a whole-funnel view, the first real step is building a reliable map of your store’s shopper journey. You can’t fix what you can’t see, and most teams are flying blind with incomplete data.
Start by connecting GA4 and setting up funnel exploration reports. GA4’s funnel exploration tool lets you define each step of the journey, from landing page to product view to add-to-cart to checkout initiation to purchase, and shows you exactly where users drop off. Layer heatmaps and session recordings on top of that to understand why they drop off, not just where.
Diagnostic tools and what they reveal
| Tool | Method | What it reveals |
|---|---|---|
| GA4 funnel exploration | Step-by-step funnel report | Drop-off rates at each stage |
| Hotjar or Microsoft Clarity | Heatmaps and recordings | User behavior, friction points |
| Triple Whale or Northbeam | Attribution modeling | True ROAS by channel |
| Klaviyo or Postscript | Email and SMS flow data | Post-purchase engagement gaps |
Once your funnel analytics tools are in place, run a structured audit using this process:
Pro Tip: Always segment your funnel data by device type and traffic source before drawing conclusions. A checkout drop-off that looks like a copy problem might actually be a mobile UX issue affecting only paid social traffic. Slicing the data this way can save you weeks of testing the wrong hypothesis.
The goal of this phase is not to fix anything yet. It’s to build a clear, evidence-based picture of where revenue is leaking and why. That picture becomes your testing roadmap.
With funnel leaks mapped, it’s time to actively address them using systematic testing and optimization. The biggest mistake teams make here is prioritizing tests by conversion rate alone. CVR tells you what percentage of visitors buy, but it doesn’t tell you how much revenue each test actually moves.

The better metric is revenue per visitor (RPV = CVR x AOV). A test that lifts CVR by 0.5% but drops AOV by 20% is a net loss. RPV captures both dimensions at once. Use it to rank your test backlog before you run a single experiment.
Focus 60% of your test portfolio on product pages, cart pages, and checkout. That’s where intent is highest and where changes have the most direct revenue impact. The remaining 40% can go toward landing pages, ad creative, and post-purchase flows.
Here’s how to run a structured A/B test:
You can explore landing page test types to build a smarter test backlog, and static ad testing frameworks to extend that discipline into your ad creative. Both layers of the funnel need to be tested together for compounding gains.
Pro Tip: If your store is driving significant traffic volume, prioritize checkout fixes first. Even a 1% lift in checkout completion rate on a high-traffic store can generate more revenue than a 5% lift on a low-traffic product page. Volume amplifies every percentage point.
Teams that hit a growth ceiling are often making the same mistake: they run tests on the pages they think matter rather than the pages their data says are leaking the most revenue. Understanding brand scaling challenges helps you recognize when your testing strategy itself is the bottleneck.
After implementing and testing new strategies, it’s critical to measure impact and lock in ongoing improvements. A single winning test is not a growth strategy. The compounding effect comes from building a system that continuously identifies, tests, and validates improvements across the funnel.
Track these four metrics to measure true funnel health:
Pre vs. post-optimization performance snapshot
| Metric | Pre-optimization | Post-optimization target |
|---|---|---|
| CVR | 2.1% | 3.0%+ |
| Cart abandonment | 78% | Below 70% |
| RPV | $1.80 | $2.50+ |
| ROAS (Meta) | 2.8x | 4x+ |
| CAC | $180 | Below $156 |
See how RPV shifts when you apply integrated funnel fixes in our supplement brand case study. The numbers tell a clear story about what happens when you stop optimizing in isolation.
Habits of teams that consistently improve funnel outcomes:
Iteration is the engine. One test cycle gives you a data point. Ten test cycles give you a compounding growth system.
Here’s the uncomfortable truth we’ve seen across four years of funnel audits: most teams are optimizing the wrong thing with the wrong metric. They focus on conversion rate because it’s easy to understand, easy to report, and easy to run tests around. But CVR in isolation is a vanity metric if it’s not connected to revenue.
We’ve seen stores celebrate a 0.8% CVR lift on a product page while their AOV quietly dropped because the test changed the product mix being promoted. Net revenue went down. The test was called a win.
Prioritizing by RPV over CVR alone is the single most important shift a growth team can make. It forces every hypothesis to answer one question: does this change make us more money per visitor?
Siloed fixes also hit a ceiling fast. You can squeeze your checkout page for months and still not move the needle if your product pages aren’t building enough desire to carry shoppers through. The stages are connected. Optimizing one without the others is like fixing a leak in one pipe while ignoring two others.
Our contrarian recommendation: build your test hypotheses from recurring funnel leaks, not from new feature ideas or competitor copy. The data in your own analytics is more valuable than any industry trend. See how integrating RPV with funnel fixes produces results that CVR-only optimization simply can’t replicate.
Pro Tip: When you find a recurring drop-off point across multiple traffic sources and devices, that’s your highest-priority test. Recurring leaks are systemic problems, not one-off anomalies, and fixing them moves revenue at scale.
A clear framework gets you started, but execution speed and testing depth are where most in-house teams hit their limits. At Blue Bagels, we’ve spent four years running funnel audits, building high-converting landing pages, and engineering ad creative that feeds qualified traffic into optimized funnels. We handle full-service ad creative and CRO from top-of-funnel hooks through to post-purchase flows. If your pages aren’t converting the traffic you’re paying for, our conversion-ready landing pages are built specifically to fix that. Browse our client case studies to see the revenue impact of integrated funnel optimization done right.
Connect GA4 funnel exploration and heatmaps to spot exact drop-off points, then segment by device and traffic source to find targeted fixes that actually move revenue.
Focus on RPV, CVR, ROAS by channel, and CAC. Industry benchmarks for 2026 show email at 6 to 10x ROAS, paid search at 4 to 6x, Meta at 3 to 5x, and average CAC around $156.
Tests on product, cart, and checkout pages consistently deliver the largest revenue gains. Focusing 60% of tests on these three stages is a proven allocation for high-impact results.
RPV multiplies CVR by AOV, so it captures the true revenue impact of any change. A CVR lift that shrinks AOV can look like a win while actually reducing total revenue per visitor.
